Ideas & TechnologyGenealogy of an idea
Tulip Mania: Real Prices, a Ruin Story Traced to 1637 Satire
Treaties & Tradeoffs Filed
Tulip mania was a run-up and crash in Dutch tulip-bulb contract prices in the winter of 1636–37. The prices were real, but the story of mass ruin traces to satirical pamphlets of 1637, and Goldgar's archival study found no one identifiable as ruined by tulips [3][5][6].
Order of business (6 sections)
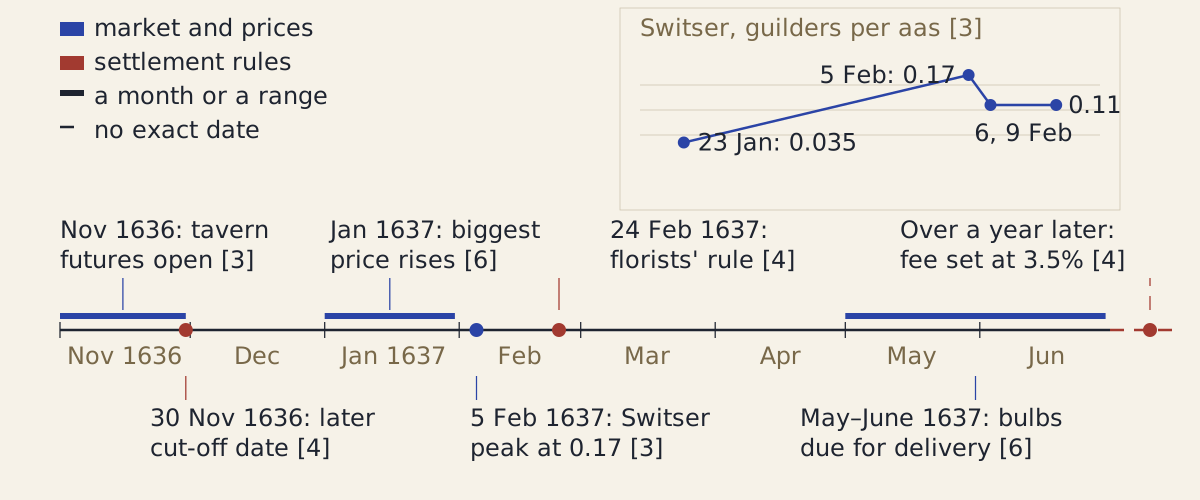
Figure: Dated events of winter 1636–37, with Garber's Switser contract prices in the inset. Bars mark a month or a range; the dashed mark has no exact date.
Diagram: Treaties & Tradeoffs. CC BY 4.0. Open full size
Reuse credit
Diagram: Treaties & Tradeoffs, "Tulip mania: dated events of winter 1636–37" — https://treatiesandtradeoffs.com/ideas/tulip-mania/, CC BY 4.0 (https://creativecommons.org/licenses/by/4.0/)
Data: Prices: Peter M. Garber, "Famous First Bubbles," Journal of Economic Perspectives 4, no. 2 (1990): 35–54, Table 2 and p. 37; Dates: Thompson & Treussard, working paper (undated); Anne Goldgar, The Conversation (2018)
The timeline as text
- November 1636: a futures market in common bulbs opens in taverns [3].
- 30 November 1636: the cut-off date in the later settlement rule [4].
- January 1637: the biggest price rises [6].
- 23 January 1637: Switser contracts at 0.035 guilders per aas [3].
- 5 February 1637: Switser at 0.17, the apparent peak [3].
- 6 and 9 February 1637: Switser at 0.11 [3].
- 24 February 1637: the florists' resolution in Amsterdam [4].
- May and June 1637: bulbs due for delivery [6].
- More than a year later: the settlement fee fixed at 3.5 percent of the contract price [4].
On 5 February 1637, a Haarlem priest warned his nephew of a new sickness among the florists. The priest, Jodocus Cats, reported that one bulb already priced at 600 guilders had tripled within three weeks, according to historian Anne Goldgar's 2007 study, and economist Peter Garber's price data put the peak of tulip mania on that same day [3][5].
What was tulip mania?
Reported: Tulips were still new and rare in Holland in the 1630s, and the bulbs that fetched high prices carried a mosaic virus that streaked the petals in feathered patterns, a pattern that bred true only through buds of the mother bulb, never from seed [3][5]. Because the bulbs spent most of the year underground, sales took the form of contracts for future payment and delivery, which after the crash came to look like windhandel, a trade in wind [5].
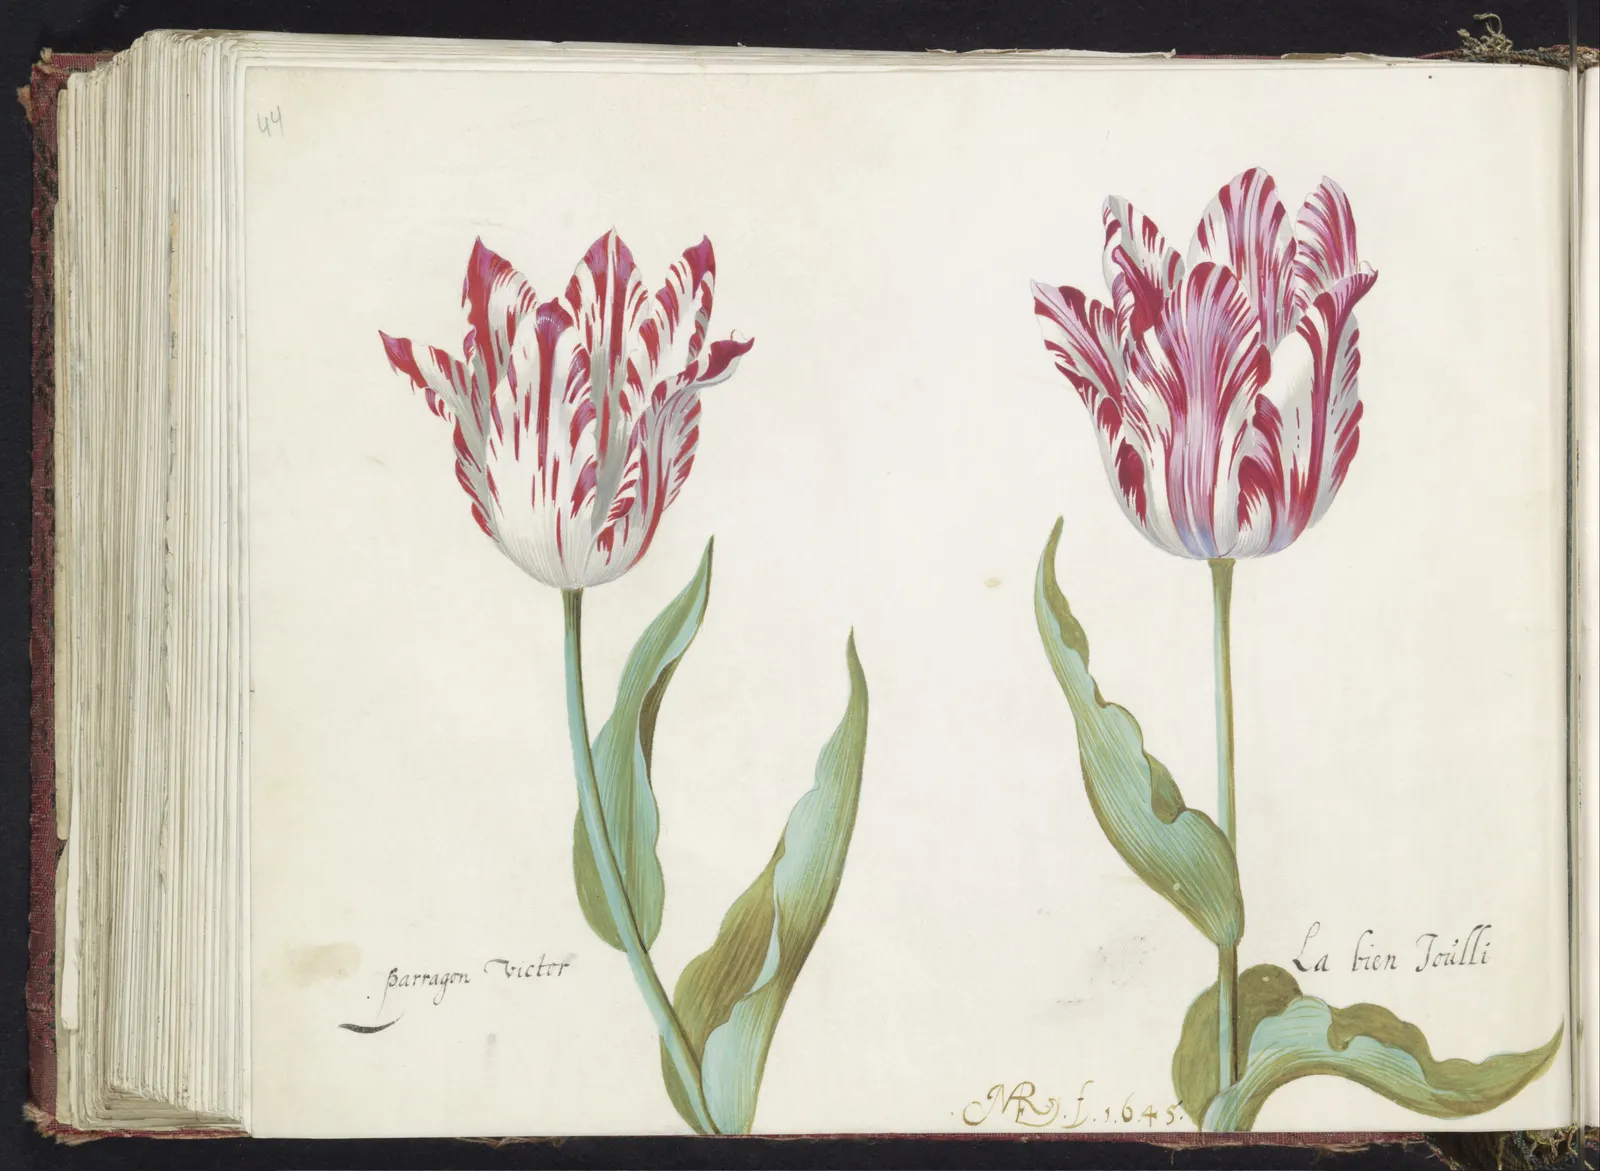
Figure: Two tulips with feathered petals, watercolour and bodycolour on vellum by Jacob Marrel, 1645, from an album now in the Rijksmuseum.
"Twee tulpen" by Jacob Marrel — https://commons.wikimedia.org/wiki/File:Twee_tulpen,_RP-T-1950-266-44-1.jpg — CC0 1.0 (https://creativecommons.org/publicdomain/zero/1.0/)

Reported: In November 1636 a futures market in common bulbs opened in local taverns, where each sale carried a payment of “wine money,” and the biggest price rises followed in January 1637 [3][6]. Garber's figures for one common variety, Switser, show the speed. Contracts went from 0.035 guilders per aas (one-twentieth of a gram) on 23 January to 0.17 on 5 February, nearly a fivefold rise in under two weeks, and notarized deals on 6 and 9 February were back at 0.11 [3]. In early February the market broke, and for the most part buyers would not pay, which left sellers holding the bulbs [5].
Assessed: Read as a price chart, those weeks look like madness. Traders at the time saw something narrower: a scarce, fashionable good, sold on paper, with delivery months away and prices that had been climbing for weeks [3][6].
How much did a tulip bulb cost in 1637?
Reported: Goldgar puts the most expensive tulips at around 5,000 guilders, the price of a well-appointed house, while Tim Harford, writing for the BBC in 2020, gives 5,200 guilders as the highest single-bulb price “for which we have good evidence” from that winter [6][7]. Most prices were far lower, Goldgar writes, and she identified only 37 people who spent more than 300 guilders on bulbs, a sum she equates with about a master craftsman's yearly wage [6]. Garber's table of three named bulbs sits between those extremes. On 5 February 1637 an English Admiral was priced at 700 guilders, an Admirael van Eyck at 1,345 and a General Rotgans at 805; by 1642 or 1643 the same varieties fetched 210, 220 and 138 guilders [3].
What was a tulip worth in a craftsman's wages?
For a scale from the time, we converted these prices into days of wages. The rate is the daily wage of a master craftsman (meester) in the Amsterdam and Holland series that Robert C. Allen compiled from J. de Vries and A. van der Woude (1997): 25.29 stuivers a day at the 1635 benchmark, the closest to 1637, with 20 stuivers to the guilder [2]. Goldgar's buyers came mainly from the merchant and skilled-artisan class, so a craftsman's wage is the closest available match to the people in the trade [6].
Reported, with our conversion: At that rate, the 300-guilder line equals about 237 days of a master's wage and the 5,200-guilder bulb about 4,112 days. The English Admiral of 5 February 1637 equals about 554 days, and the same variety in 1642 or 1643 about 175 days at the 1640 benchmark of 24.04 stuivers [2][3].
Assessed: The 237-day figure matches Goldgar's “yearly wage” only if a master was paid for about 240 days a year; we found no source for paid days, so we do not convert to years. Wage-days show what a price meant to that worker then and there, not a modern-dollar value or a living standard.
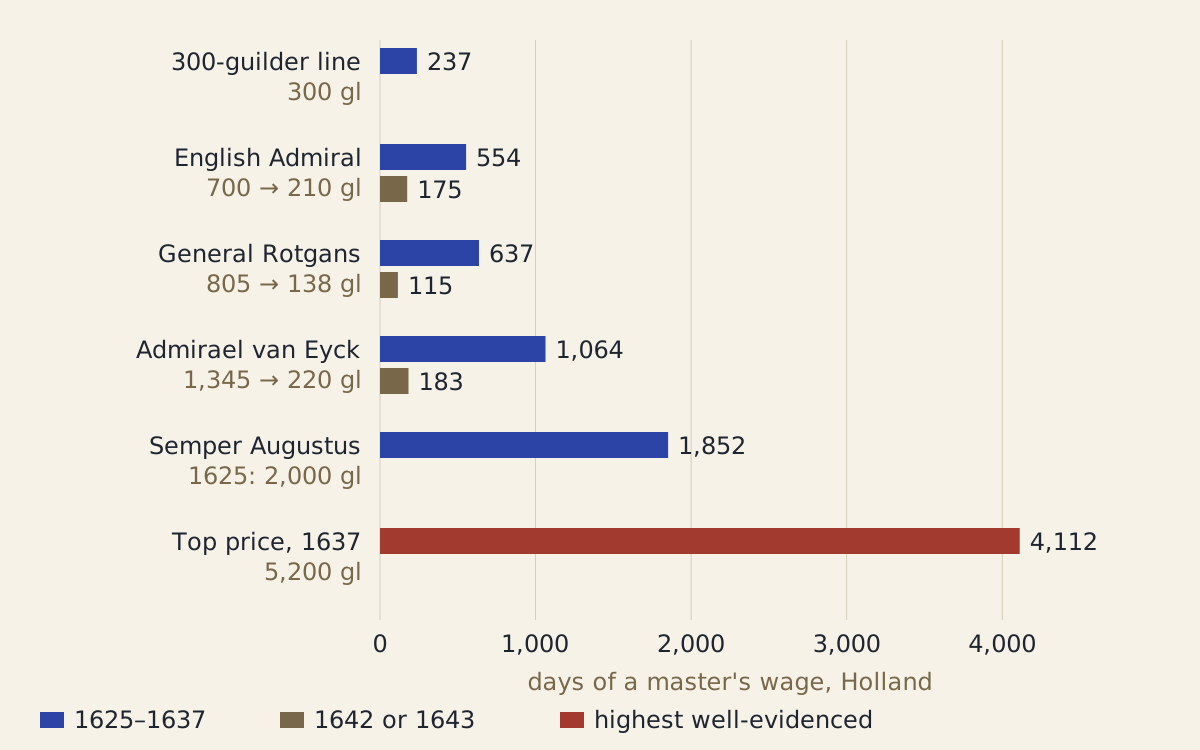
Figure: Tulip prices counted in days of a Holland master craftsman's wage. Inputs in the conversion table below.
Diagram: Treaties & Tradeoffs. CC BY 4.0. Open full size
Reuse credit
Diagram: Treaties & Tradeoffs, "Tulip prices in days of a Holland master craftsman's wage" — https://treatiesandtradeoffs.com/ideas/tulip-mania/, CC BY 4.0 (https://creativecommons.org/licenses/by/4.0/)
Data: Wages: Robert C. Allen, "Prices and Wages in Amsterdam & Holland, 1500–1914" (wages from J. de Vries and A. van der Woude, The First Modern Economy, 1997), individual daily wage figures; Prices: Peter M. Garber, "Famous First Bubbles," Journal of Economic Perspectives 4, no. 2 (1990): 35–54, Table 2 and p. 37; Anne Goldgar, The Conversation (2018); Tim Harford, BBC News (2020)
Where did the story of mass ruin come from?
Reported: Mackay's chapter “The Tulipomania” is the basis of most modern images of the craze, in Goldgar's reading [5]. He wrote that “the population, even to its lowest dregs, embarked in the tulip trade,” and that “substantial merchants were reduced almost to beggary.” He ended his account of the Dutch trade with the claim that “the commerce of the country suffered a severe shock, from which it was many years ere it recovered” [1].
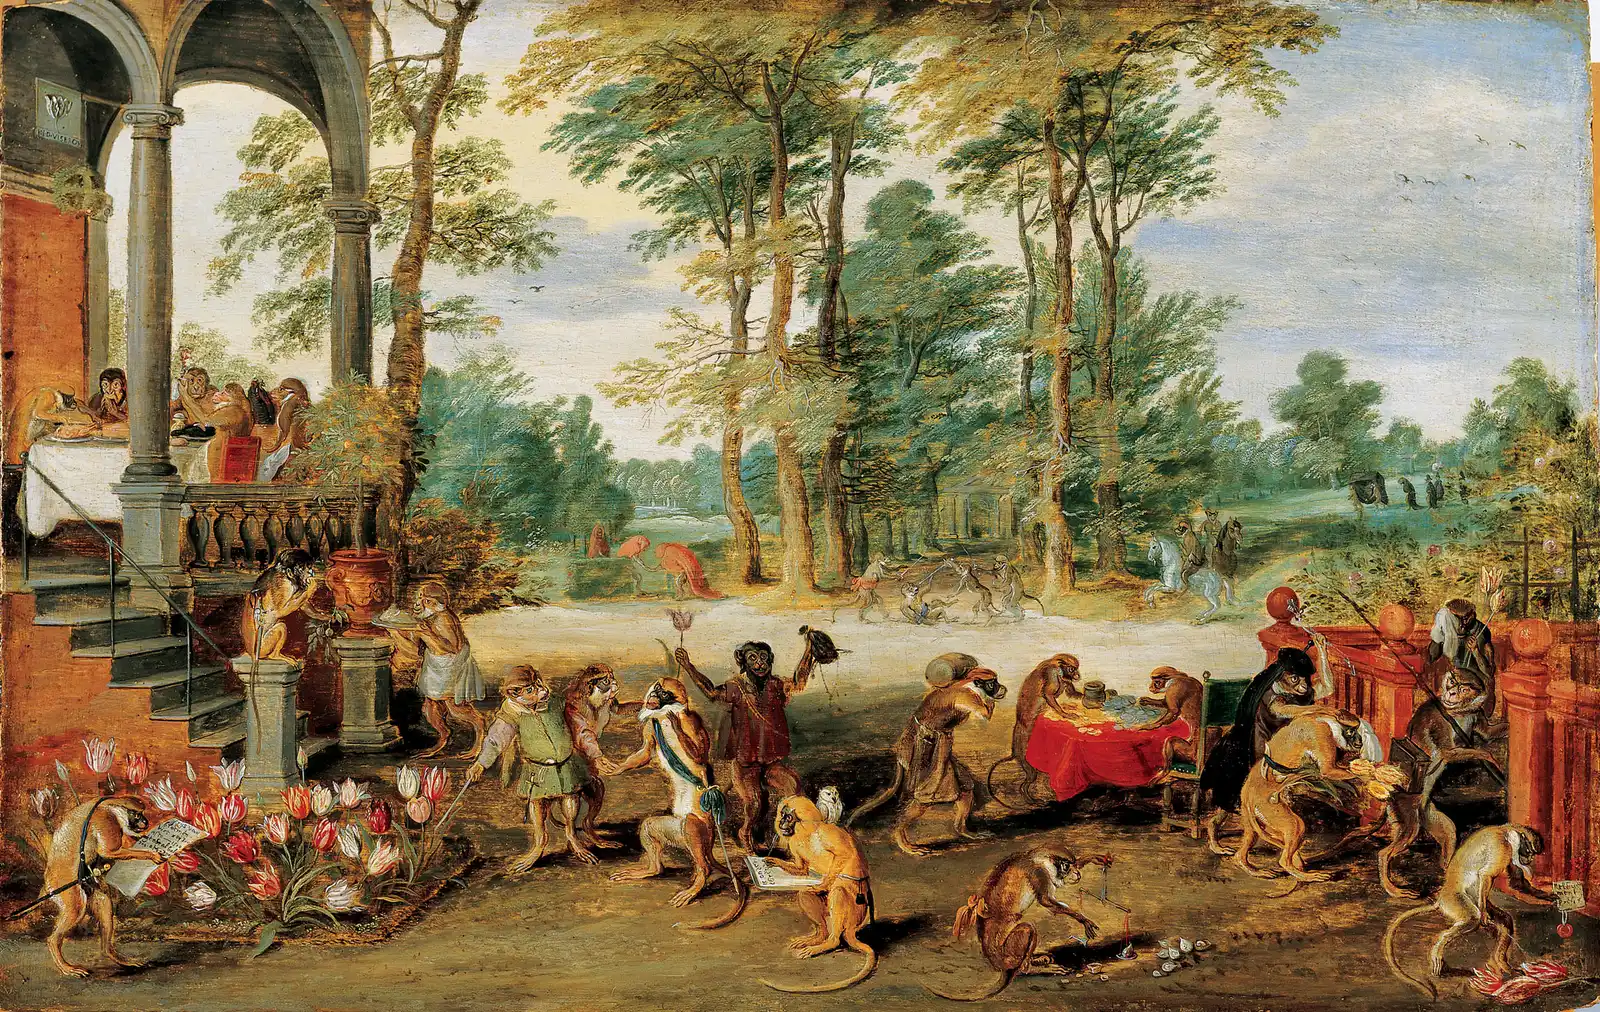
Figure: Satire on the Tulipomania by Jan Brueghel the Younger, 1640s, oil on panel (Frans Hals Museum, Haarlem).
"Satire on the Tulipomania" by Jan Brueghel the Younger — https://commons.wikimedia.org/wiki/File:Persiflage_auf_die_Tulpomanie.jpg — Public domain (painter d. 1678; public domain in the US and the EU; faithful reproduction of a two-dimensional work, Frans Hals Museum os 75-699)

Reported: Goldgar traced where Mackay got this. His chief source was Johann Beckmann, whose history of inventions went through many English editions from 1797 on, and Beckmann relied mainly on Abraham Munting, a botanical writer of the early 1670s [5]. Munting took his words, often verbatim, from the chronicler Lieuwe van Aitzema (1669) and from a 1637 dialogue written against the trade, Samen-spraeck tusschen Waermondt ende Gaergoedt, which Goldgar cites under the name of Adriaen Roman, while Aitzema in turn worked from the pamphlets [5]. Goldgar concludes that the familiar picture rests on one or two pieces of contemporary propaganda and a great deal of copying [5].
Reported: Garber reached a similar finding: in his reading, all the sources go back to three anonymous dialogue pamphlets of 1637, written by partisans against speculation [3]. Goldgar adds that even the leading Dutch accounts, by the economic historian N. W. Posthumus (late 1920s and early 1930s) and the bulb grower Ernst Krelage (1942), rest mainly on the pamphlets [5].
Think of the story's route to Mackay as a supply line with a single depot. Each later writer drew stock from the 1637 pamphlets, or from someone who had, and in Goldgar's account the result was a picture based almost solely on propaganda [5].
Reported: From Mackay the story passed into economics. Garber found the 1926 edition of Palgrave's Dictionary of Political Economy defining a bubble and giving tulipmania as an example, Paul Samuelson citing it in 1957 and 1967, and Charles Kindleberger's 1987 entry in The New Palgrave naming it one of the two most famous manias [3].
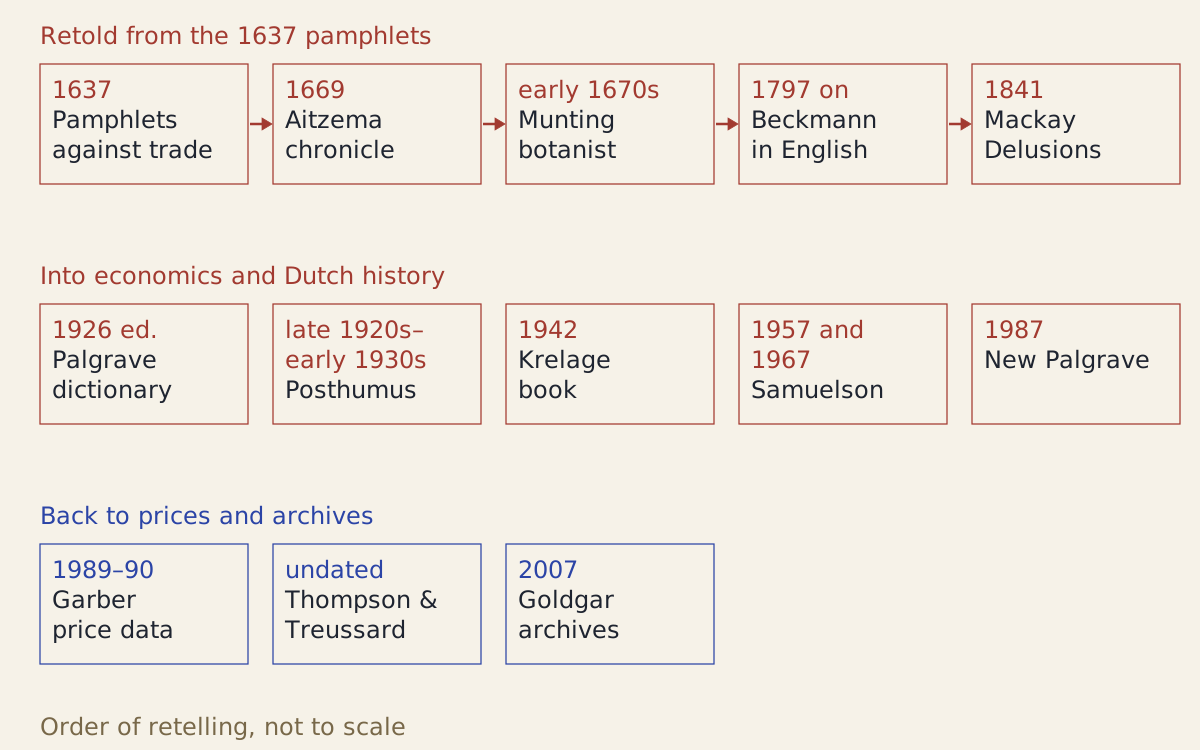
Figure: The order in which the ruin story was retold, from the 1637 pamphlets to Mackay and into economics, and the later return to prices and archives. Not to scale.
Diagram: Treaties & Tradeoffs. CC BY 4.0. Open full size
Reuse credit
Diagram: Treaties & Tradeoffs, "How the tulip mania story was retold, 1637 to 2007" — https://treatiesandtradeoffs.com/ideas/tulip-mania/, CC BY 4.0 (https://creativecommons.org/licenses/by/4.0/)
Data: Anne Goldgar, Tulipmania (2007), excerpt pp. 1–7; Peter M. Garber, Journal of Economic Perspectives (1990)
The order of retelling as text
- 1637: dialogue pamphlets written against the trade [3][5].
- 1669: Lieuwe van Aitzema's chronicle, drawing on the pamphlets [5].
- Early 1670s: Abraham Munting, quoting Aitzema and Roman's dialogue [5].
- 1797 on: Johann Beckmann's history of inventions in English, relying chiefly on Munting [5].
- 1841: Charles Mackay, Extraordinary Popular Delusions, relying chiefly on Beckmann [5].
- 1926 edition: Palgrave's Dictionary of Political Economy gives tulipmania as an example of a bubble [3].
- Late 1920s and early 1930s: N. W. Posthumus's articles, based mainly on the pamphlets [5].
- 1942: Ernst Krelage's book, based mainly on the pamphlets [5].
- 1957 and 1967: Paul Samuelson cites it [3].
- 1987: The New Palgrave names it one of the two most famous manias [3].
- 1989–90: Peter Garber returns to price data [3].
- Undated: Earl Thompson and Jonathan Treussard read the contracts as options [4].
- 2007: Anne Goldgar's archival study [5].
Was a Viceroy bulb really traded for oxen, wheat and cheese?
Reported: Mackay prints a list of goods, from “two lasts of wheat” and “four fat oxen” to “a silver drinking-cup,” worth 2,500 florins in all, says they were “delivered for one single root of the rare species called the Viceroy,” and credits the list to an author he calls “Hunting” [1]. Goldgar reads the same list differently: it was given as equal to the cost of one Viceroy bulb, and only later did it become, for some writers, the actual cost [5].
Assessed: A list of equivalents tells you what 2,500 guilders could buy, while a list of goods handed over tells you that a buyer gave up oxen, grain and furniture for one bulb. Only the first reading is supported by the sources we read.
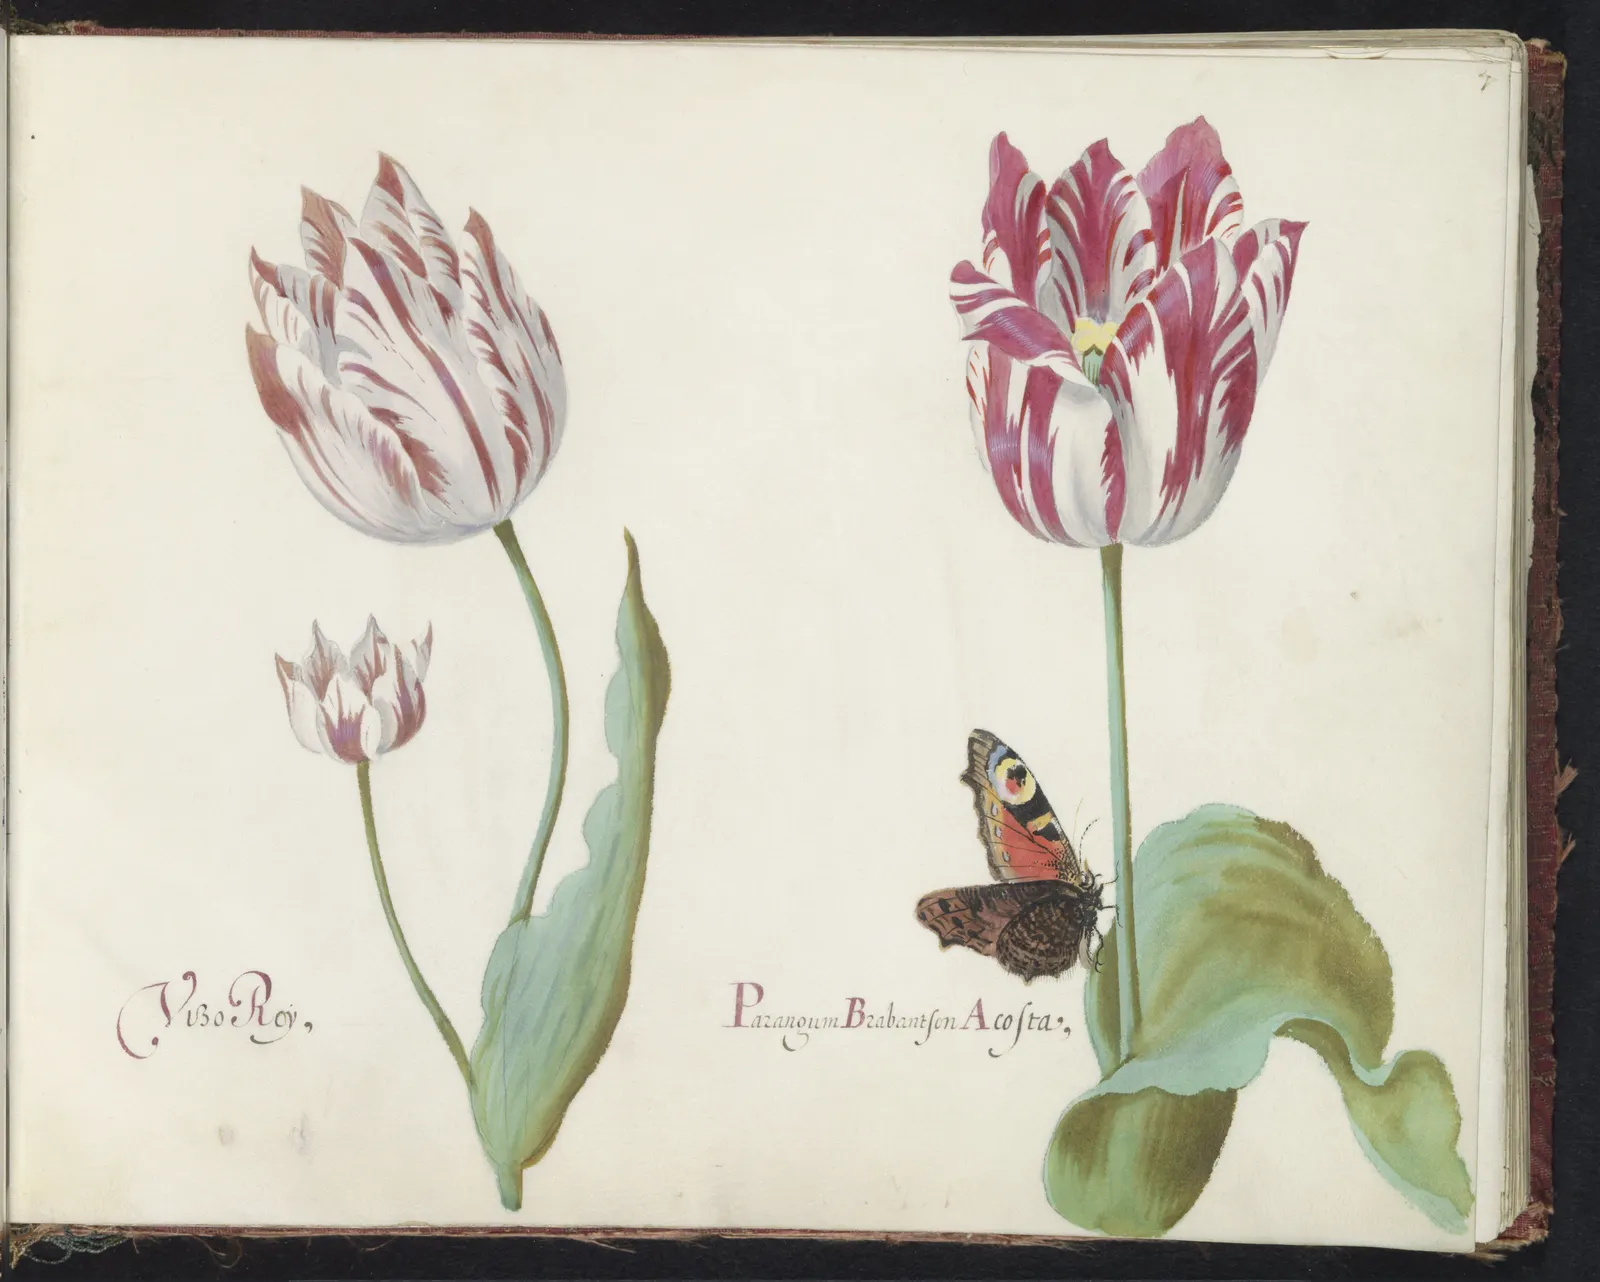
Figure: Two tulips labelled “Vizo Roy” and “Parangum Brabantsen Acosta”, watercolour and bodycolour on vellum by Jacob Marrel, 1637 (Rijksmuseum).
"Drie tulpen met dagpauwoog. Vizo Roy / Parangum Brabantsen Acosta" by Jacob Marrel — https://commons.wikimedia.org/wiki/File:Drie_tulpen_met_dagpauwoog_Vizo_Roy_Parangum_Brabantsen_Acosta_(titel_op_object),_RP-T-1950-266-7-2.jpg — CC0 1.0 (https://creativecommons.org/publicdomain/zero/1.0/)
What did the florists decide when prices broke?
The card at the top of this page applies what we call the known-then test: scoring a decision only on what its makers could know at the time, with each item tied to a source.
Reported: After the break, tulip traders in the towns met and sent deputies to Amsterdam, Mackay writes [1]. Thompson and Treussard date the key decision to 24 February 1637. In their account, the florists ruled that futures contracts written after 30 November 1636, and before the cash market reopened in spring, would be treated as options, so that a buyer could walk away by paying the seller a small fixed share of the contract price [4]. Mackay puts that share at ten percent [1].
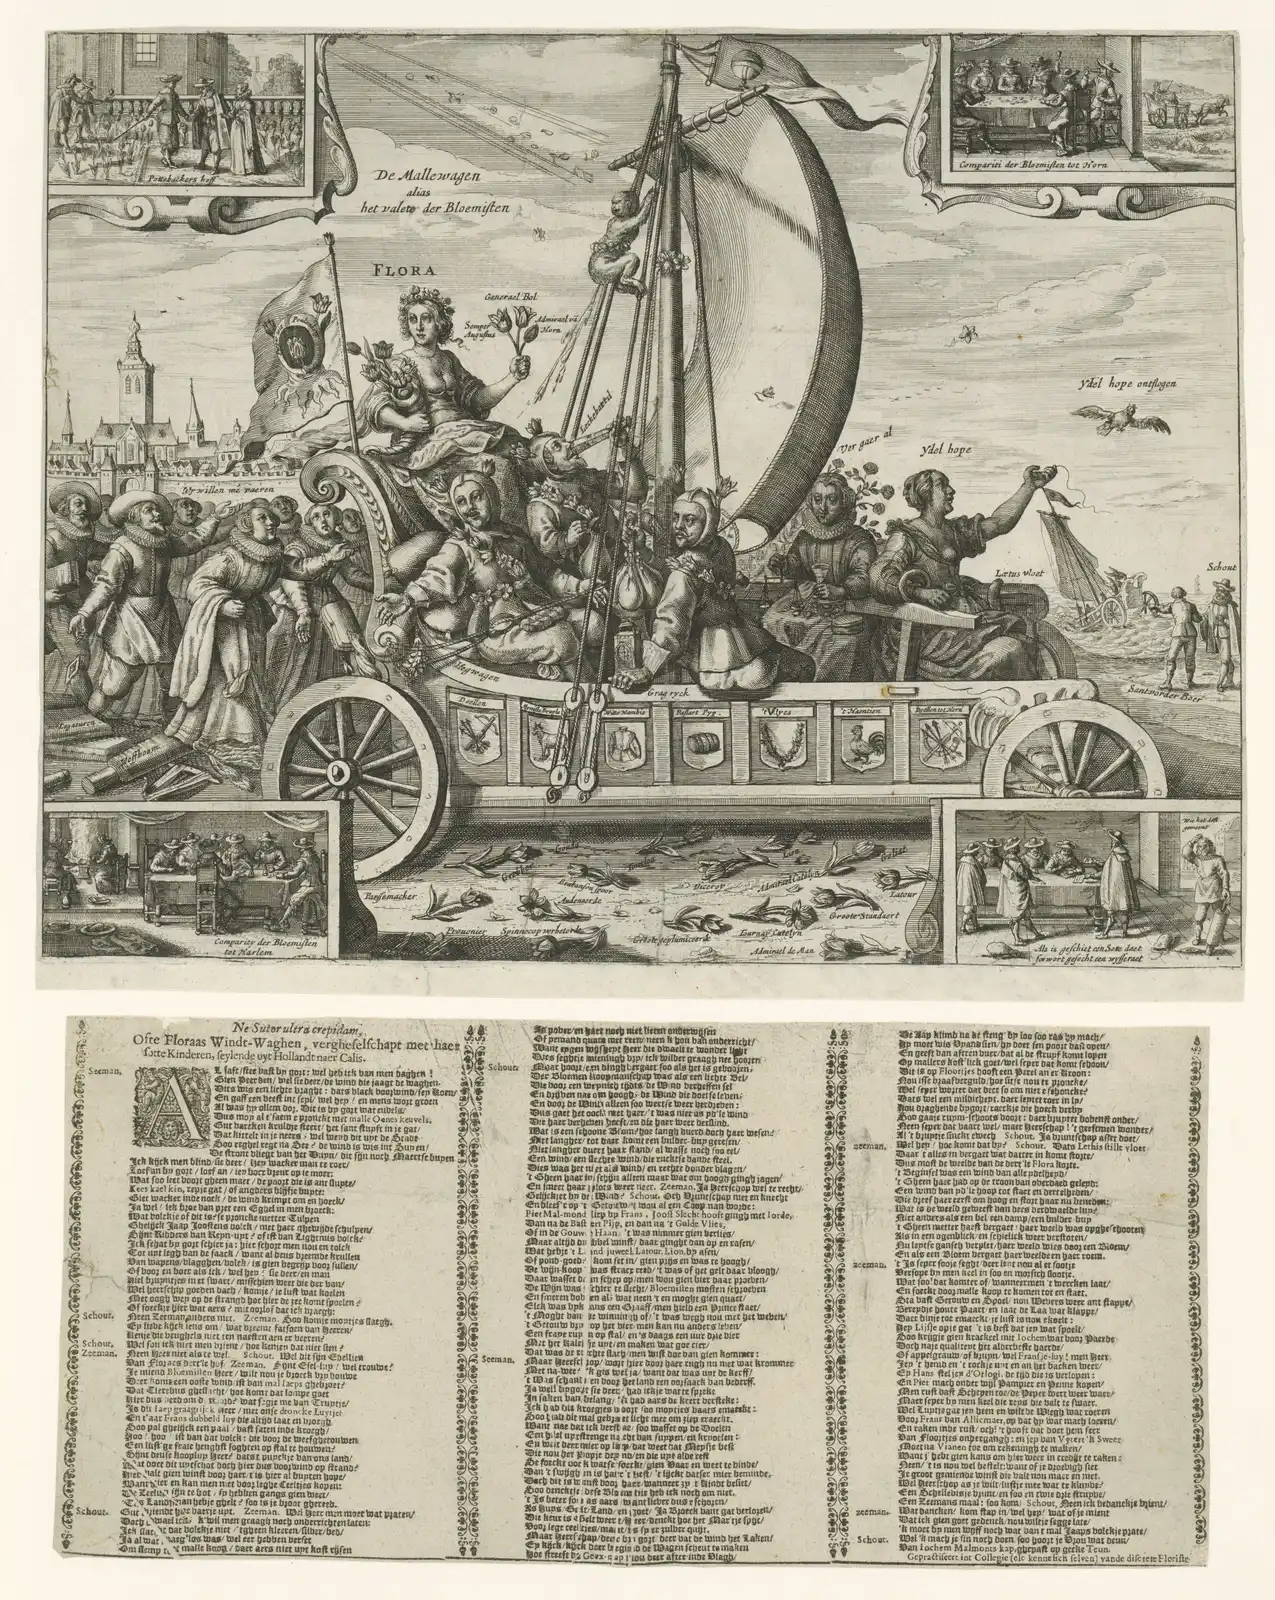
Figure: Flora's Mallewagen, a 1637 print attributed to Crispijn van de Passe II mocking the tulip trade, shown with the verse sheet that belongs to it (Rijksmuseum).
"Flora's Mallewagen (De Mallewagen alias het valete der Bloemisten)" by Crispijn van de Passe II (attributed) — https://commons.wikimedia.org/wiki/File:Flora's_Mallewagen,_1637_De_Mallewagen_alias_het_valete_der_Bloemisten_(titel_op_object),_RP-P-OB-77.710.jpg — CC0 1.0 (https://creativecommons.org/publicdomain/zero/1.0/)
Put yourself among the delegates. You know that prices have just fallen hard, that no bulb can change hands until early summer, and that the newest contracts were signed in the weeks of fastest rise [3][6]. You do not know how far prices will fall, or whether any court will make a buyer pay.
Assessed: Given what the delegates knew, a date cut-off made sense as a sorting rule, because it singled out the contracts signed during the fastest part of the rise. What happened to older contracts is less clear: Mackay says they were declared void, a detail we could not confirm in the modern sources we read [1].
Who had the final say over the contracts?
Reported: The state's role is where the sources disagree. Thompson and Treussard write that the florists' decision was later ratified by the Dutch legislature, and that the fee was finally set at 3.5 percent of the contract price after more than a year of negotiation [4]. Goldgar's archival account describes authorities who reacted slowly and hesitantly, and a provincial court of Holland that suggested the parties talk it out among themselves and stay out of the courts [6].
Reported: Goldgar calls the February losses notional: anyone who had both bought and sold a tulip on paper since the summer of 1636 had lost nothing, and the sellers still waiting for payment could bear the loss [6].
Did tulip mania ruin the Dutch economy?
Reported: Goldgar found no bankrupt in these years who could be identified as ruined by tulips; when tulip traders appear in bankruptcy records, they are buying the houses and goods of people who had failed for other reasons [6]. She describes the Dutch economy as unaffected, and Garber found no evidence of serious economic distress, noting that histories of the period treat it as a golden age [3][6].
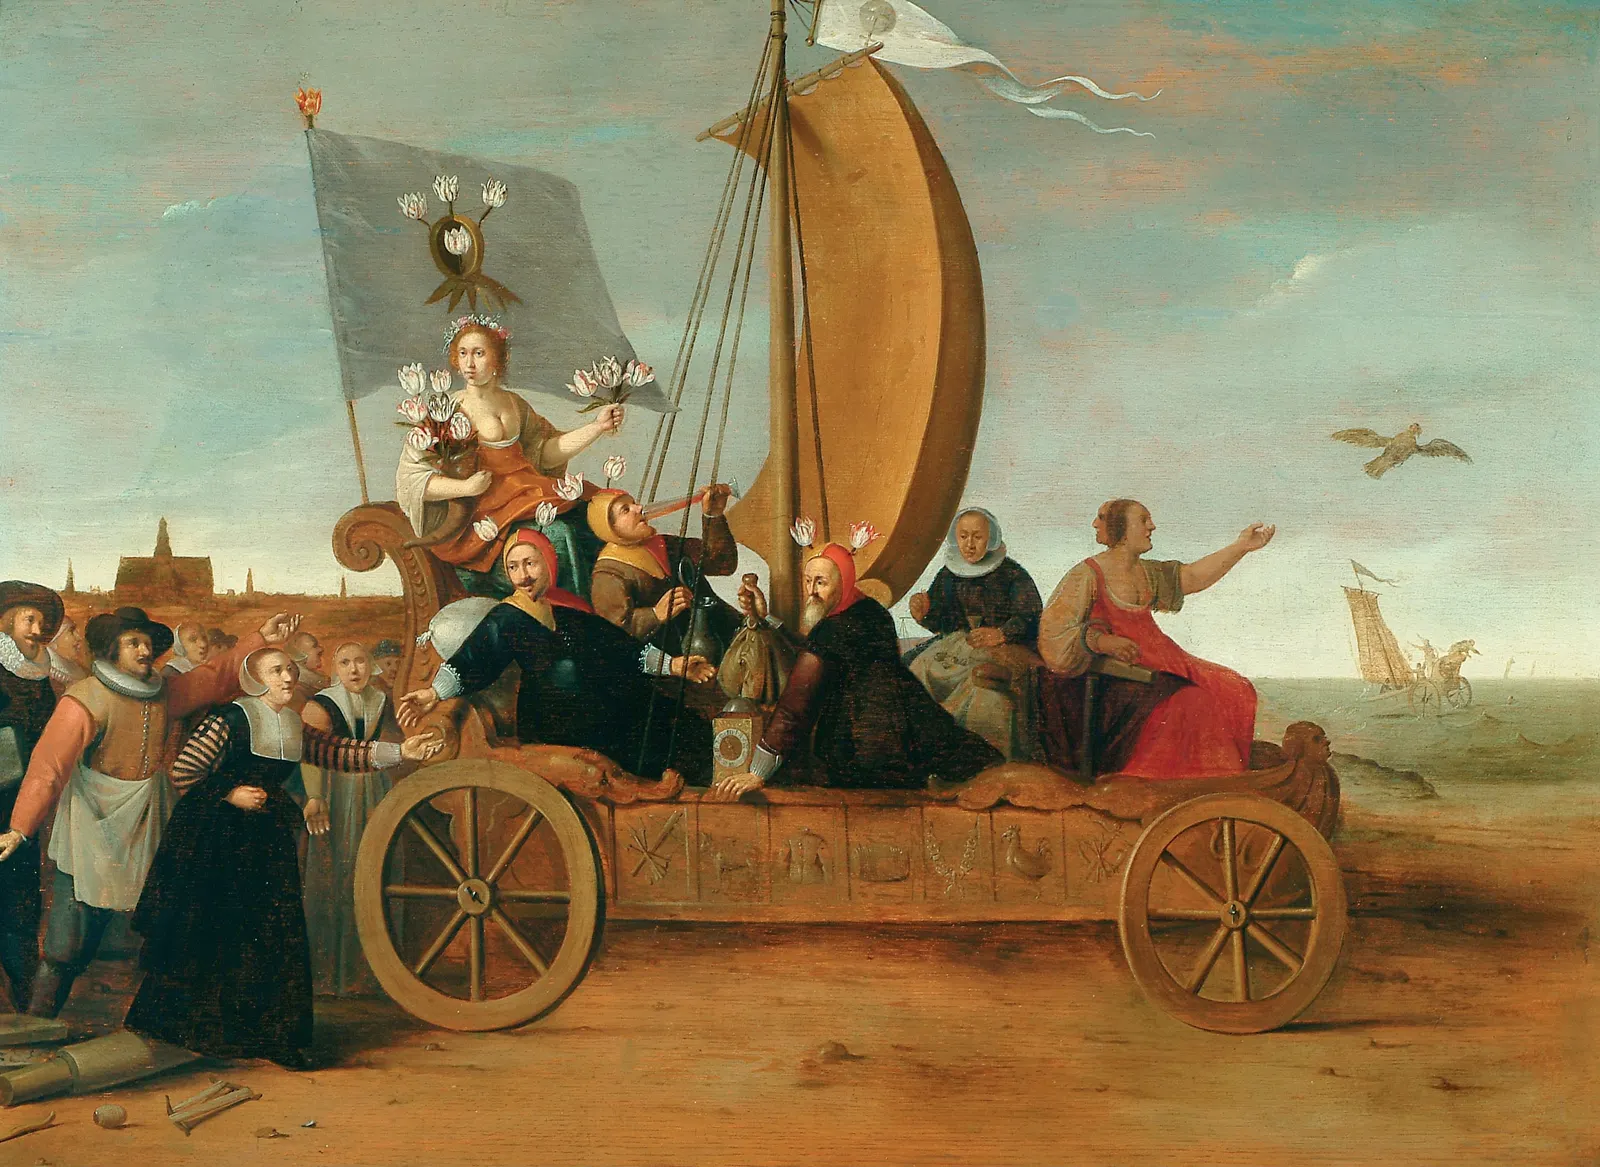
Figure: Flora's Wagon of Fools, an allegory of the tulip trade by Hendrik Gerritsz Pot, about 1637, oil on panel (Frans Hals Museum, Haarlem).
"Flora's Wagon of Fools" by Hendrik Gerritsz Pot — https://commons.wikimedia.org/wiki/File:Flora's_Wagon_of_Fools_(Flora's_Mallewagen)_tulipomania,_Hendrik_Gerritsz_Pot_c1637.jpg — Public domain (painter d. 1657; public domain in the US and the EU; faithful reproduction of a two-dimensional work, Frans Hals Museum os I-286)
Reported: Who traded is contested. Goldgar describes buyers drawn mainly from the merchant and skilled-artisan class, often linked by family, religion or neighborhood, and she never found a chain of buyers longer than five [6]. Garber describes the tavern market in common bulbs as a mid-winter diversion among people with almost no wealth [3].
Assessed: The two findings can both hold if they describe different layers of the trade, but neither source we read counts the tavern traders, so we leave the question open.
The popular version against the record
| Popular version | Where it appears | What the record shows |
|---|---|---|
| Everyone traded, “even chimney-sweeps and old clothes-women” | Mackay [1] | Mainly merchants and skilled artisans [6]; Garber puts a tavern market among the poor [3]. The sources disagree. |
| Bulbs changed hands hundreds of times | Retellings, per Goldgar [5] | No buyer chain longer than five [6] |
| A Viceroy bulb was paid for in oxen, grain and a silver cup | Mackay [1] | The list gave an equivalent value; only later was it read as the price paid [5] |
| A sailor ate a Semper Augustus bulb as an onion | Mackay [1] | Probably false, per Harford [7] |
| Merchants were “reduced almost to beggary” | Mackay [1] | No bankrupt identified as ruined by tulips [6] |
| Dutch commerce suffered for years | Mackay [1] | No sign of serious distress [3][6] |
| Prices collapsed in February 1637 | The standard version, as summarized by Garber [3] | Supported: Switser fell from 0.17 to 0.11 guilders per aas within days [3] |
Full table with sources (CSV) Source and license notes (JSON) Data: Charles Mackay, Memoirs of Extraordinary Popular Delusions (1852), Project Gutenberg, accessed 2026-11-02, public domain; Peter M. Garber, "Famous First Bubbles," Journal of Economic Perspectives 4, no. 2 (1990): 35–54, accessed 2026-11-02, copyrighted, individual figures cited; Thompson & Treussard, "The Tulipmania: Fact or Artifact?" (working paper, undated), accessed 2026-10-07, copyrighted, individual figures cited; Anne Goldgar, Tulipmania (University of Chicago Press, 2007), publisher's excerpt pp. 1–7, accessed 2026-11-02, copyrighted, individual figures cited; Anne Goldgar, The Conversation (2018), accessed 2026-10-07, copyrighted, individual figures cited; Tim Harford, BBC News (2020), accessed 2026-10-07, copyrighted, individual figures cited
Was tulip mania a bubble at all?
Reported: Garber argued in 1990 that tulip mania should not count as a bubble, because prices of a prized new flower variety follow a standard pattern: the first bulbs sell high, and prices fall fast as bulbs multiply [3]. For his three bulbs he reports an average fall of 32 percent a year from February 1637 to 1642, close to the 28.5 percent a year he found for prized bulbs in the 18th century, which leaves the crash itself room for no more than a 16 percent price decline [3]. He made the same kind of argument about the Mississippi and South Sea schemes of 1719 and 1720 [3].
Reported, with our check: We reran Garber's arithmetic from his own table. The 32 percent matches a continuously compounded rate over five years, meaning the natural log of each price ratio divided by five (the three bulbs give 24.1, 36.2 and 35.3 percent, an average of 31.9). His 16 percent follows the same way, from 3.5 extra points a year over five years. Counted as plain year-on-year losses, the three bulbs lost about 27 percent a year, and 70 to 84 percent in total [3].
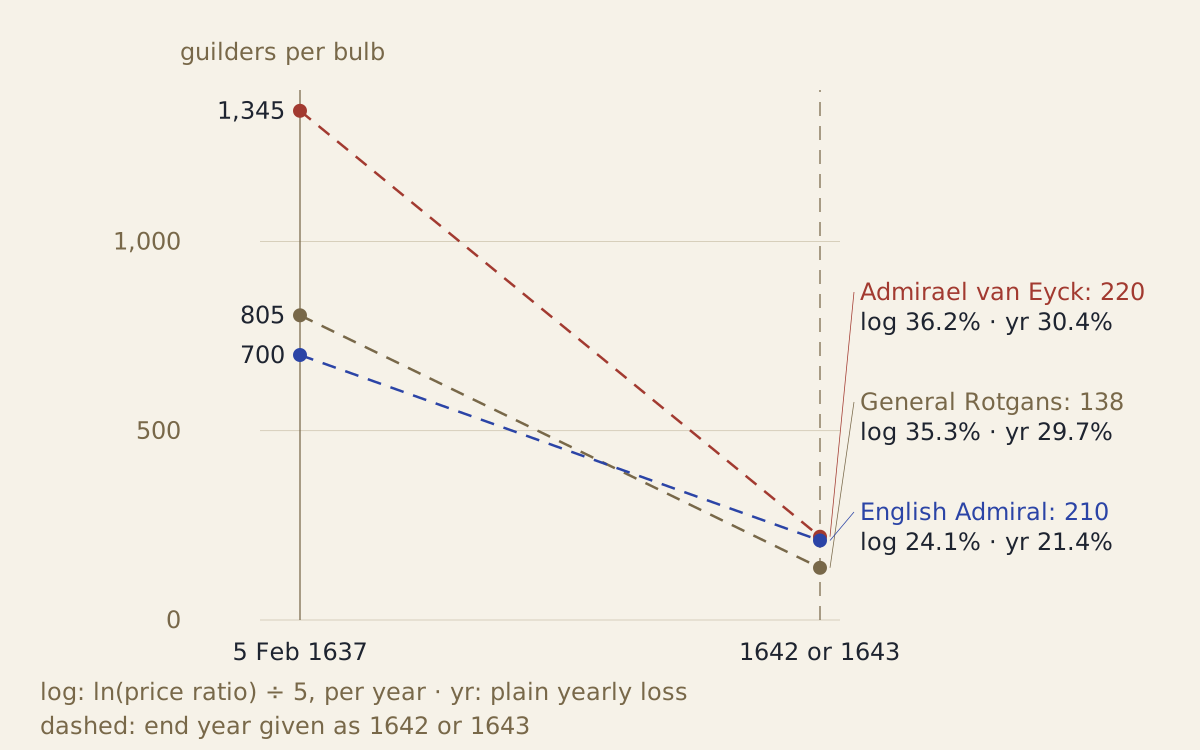
Figure: Garber's prices for three named bulbs on 5 February 1637 and in 1642 or 1643, with the yearly rates of fall worked out from his table.
Diagram: Treaties & Tradeoffs. CC BY 4.0. Open full size
Reuse credit
Diagram: Treaties & Tradeoffs, "Garber's three bulbs, 1637 and 1642 or 1643" — https://treatiesandtradeoffs.com/ideas/tulip-mania/, CC BY 4.0 (https://creativecommons.org/licenses/by/4.0/)
Data: Prices: Peter M. Garber, "Famous First Bubbles," Journal of Economic Perspectives 4, no. 2 (1990): 35–54, Table 2 and p. 37
Did the contracts turn into options?
Reported: In an undated UCLA working paper, Earl Thompson and Jonathan Treussard read the numbers differently. Their quality-weighted index of contract prices stood about 20 times higher in early February 1637 than in early November 1636 or early May 1637, an annualized fall they put at 99.999 percent, against 38 percent in the least stable of Garber's hyacinth markets [4].
Reported: Their explanation is the contract change described above. An option gives the right, but not the duty, to buy at a set price, and once buyers could walk away for a small fee, a contract price behaved like that set price, so the headline prices overstated what sellers expected to receive [4].
Assessed: Neither economist settles whether the winter's prices were rational, and the sources we read do not let us settle it either. Much of the folly in the standard story is what we call the hindsight premium: the extra foolishness a decision acquires once everyone knows how it ended. Strip it out and the record shows a short, fast market in a luxury good, with the ruin added later, in print, by the trade's critics and the writers who copied them.
Wage-day conversion table
Method: guilders × 20 ÷ daily wage in stuivers, from Allen's series [2], meester (master) and onge-school (unskilled) columns, at the five-year benchmark that Allen's file applies to each year: 1625 (21.6 and 14.29 stuivers), 1635 (25.29 and 19.1) for 1636–38, and 1640 (24.04 and 19.58) for 1642–43. The wage source does not say whether in-kind pay is included, and the price sources do not name the town of each sale. Decimals are in the CSV below the table.
| Item | Date | Guilders | Wage benchmark | Master days | Unskilled days | Price source |
|---|---|---|---|---|---|---|
| Goldgar's 300-guilder line | 1636–37 | 300 | 1635 | 237 | 314 | [6] |
| Most expensive tulips, approximate | 1636–37 | 5,000 | 1635 | 3,954 | 5,236 | [6] |
| Highest well-evidenced price | winter 1637 | 5,200 | 1635 | 4,112 | 5,445 | [7] |
| Semper Augustus | 1625 | 2,000 | 1625 | 1,852 | 2,799 | [3] |
| English Admiral | 5 Feb 1637 | 700 | 1635 | 554 | 733 | [3] |
| English Admiral | 1642 or 1643 | 210 | 1640 | 175 | 215 | [3] |
| Admirael van Eyck | 5 Feb 1637 | 1,345 | 1635 | 1,064 | 1,408 | [3] |
| Admirael van Eyck | 1642 or 1643 | 220 | 1640 | 183 | 225 | [3] |
| General Rotgans | 5 Feb 1637 | 805 | 1635 | 637 | 843 | [3] |
| General Rotgans | 1642 or 1643 | 138 | 1640 | 115 | 141 | [3] |
| 10% fee per 1,000 guilders of contract (illustration) | 1637 | 100 | 1635 | 79 | 105 | rate: [1] |
Download the table (CSV, tulip-mania-wage-days.csv) Source and license notes (JSON) Data: Robert C. Allen, "Prices and Wages in Amsterdam & Holland, 1500–1914" (wages from J. de Vries and A. van der Woude, The First Modern Economy, 1997, pp. 610–611), published data series, accessed 2026-10-07, copyrighted, individual daily wage figures cited; Peter M. Garber, "Famous First Bubbles," Journal of Economic Perspectives 4, no. 2 (1990): 35–54, accessed 2026-11-02, copyrighted, Table 2 and p. 37, individual prices cited; Anne Goldgar, The Conversation (2018), accessed 2026-10-07, copyrighted, individual figures cited; Tim Harford, BBC News (2020), accessed 2026-10-07, copyrighted, individual figures cited; Charles Mackay, Memoirs of Extraordinary Popular Delusions (1852), Project Gutenberg, accessed 2026-11-02, public domain, fee rate
Sources
- Charles Mackay, Memoirs of Extraordinary Popular Delusions and the Madness of Crowds, vol. 1, chapter "The Tulipomania" (London: Office of the National Illustrated Library, 1852; first published 1841). Project Gutenberg eBook #24518. https://www.gutenberg.org/ebooks/24518Read: full text of the 1852 edition
- Robert C. Allen, "Prices and Wages in Amsterdam & Holland, 1500–1914," data file amsterdam.xls (sheets "Wages" and "Conversions, Sources & Comments"; wages from J. de Vries and A. van der Woude, The First Modern Economy, 1997, pp. 610–611, linked to H. Nusteling, 1985). Bob Allen – Research Pages, Nuffield College, Oxford. https://www.nuffield.ox.ac.uk/people/sites/allen-research-pages/Read: individual daily wage figures from the data file
- Peter M. Garber, "Famous First Bubbles," Journal of Economic Perspectives 4, no. 2 (Spring 1990): 35–54. https://www.aeaweb.org/articles?id=10.1257/jep.4.2.35Read: full text in October 2026; article page with abstract in November 2026
- Earl A. Thompson and Jonathan Treussard, "The Tulipmania: Fact or Artifact?" Working paper, UCLA (undated). http://www.dklevine.com/archive/thompson-tulips.pdfRead: full text in October 2026; the file could not be opened in November 2026
- Anne Goldgar, Tulipmania: Money, Honor, and Knowledge in the Dutch Golden Age (Chicago: University of Chicago Press, 2007), excerpt from pp. 1–7. https://press.uchicago.edu/Misc/Chicago/301259.htmlRead: publisher's excerpt, pp. 1–7
- Anne Goldgar, "Tulip mania: the classic story of a Dutch financial bubble is mostly wrong," The Conversation, February 12, 2018. https://theconversation.com/tulip-mania-the-classic-story-of-a-dutch-financial-bubble-is-mostly-wrong-91413Read: full text in October 2026
- Tim Harford, "Was Tulip Mania really the first great financial bubble?" BBC News, March 4, 2020. https://www.bbc.com/news/business-51311368Read: full text in October 2026
Cite this page
Treaties & Tradeoffs. “Tulip Mania: Real Prices, a Ruin Story Traced to 1637 Satire.” published 2026-11-02. https://treatiesandtradeoffs.com/ideas/tulip-mania/. Accessed [the date you read it].
Plain citation; add the date you consulted the page. No DOI is assigned.